How-to implement Honeycomb’s OpenTelemetry collector for metrics
Hello, welcome. Take a deep breath. I know you’re excited (I’m excited!) to start cost-effectively sending metrics to Honeycomb.
If you aren’t yet familiar with Honeycomb.io is an observability tool oriented around asking questions about your system in real-time. It can consume data points from a variety of different sources (which are collectively referred to as “events”) and provides a number of ways to combine these diverse datastreams to help correlate performance dips across distributed systems.
Up until recently, Honeycomb provided several integrations with cloud provider APIs (eg AWS CloudWatch streams to investigate RDS performance) and logging platforms, but we hadn’t been able to natively send in infrastructure metrics. That gap has now been closed!
Honeycomb Metrics Overview:
Honeycomb metrics are generally available as of September 8, 2021 which means anybody with access to a Prometheus instance and a trial Honeycomb account can now explore this powerful feature in under 30 minutes.
This is terribly exciting, especially since I spend more of my direct worrying time on infrastructure than application errors. Metrics, especially the Prometheus and Clouudwatch metrics that make up the backbone of our old monitoring and alerting system, are often correlated to application issues but it’s been clunky to still be operating in multiple tools to draw those conclusions.

Metrics, Money, and Custom Collectors:
However, if you’re running Honeycomb metrics at scale, the number of metric events flooding into your Honeycomb dataset can pretty quickly chew through your event bucket. Yes, we need to invest real time and real dollars into observability to reap its full benefits. But events can and should also be “worth the calories” (thanks GBBO, I missed you). In other words, if there’s a way to get the same data but pay a little bit less, we should DO THAT.
Honeycomb’s engineering team is in the process of contributing a new time stamp processor to the OpenTelemetry Collector that will help pack more metrics data into the same event. How? In the README.md, there’s a very understated one-liner: “The timestamp processor will round all timestamps in metrics streams to the nearest
So, let’s make that happen. It does require a little extra work! But we’ll do a step by step guide and you should be on your way.
Visualizing the flow of metrics (optional, but helpful for understanding what you’re building in your environment):
 and then inserting it into a stream of servers that sends data to Honeycomb")
Implementation Steps:
Note: I’m going to be running this all on AWS EC2 instances to get started. If you’re using a different provider, please make the necessary adjustments, but the basic concepts will still hold up.
1. Set up an environment to build the Honeycomb OpenTelemetry collector
- Provision an EC2 instance based on AWS's Linux 2 AMI (ami-087c17d1fe01783150)
- Install dependencies. Note that Go version 1.17 is necessary to build the collector
```
[ec2-user@builder /home/ec2-user]:
sudo -i
yum update && yum install python3-pip jq go
pip3 install yq
## need to install go 1.17 to work with the version 0.35.0 of the opentelemetry-collector-builder
yum remove go
wget https://golang.org/dl/go1.17.1.linux-amd64.tar.gz
sudo tar -C /usr/local -xzf go1.17.1.linux-amd64.tar.gz
export PATH=$PATH:/usr/local/go/bin
wget https://github.com/open-telemetry/opentelemetry-collector-builder/releases/download/v0.35.0/opentelemetry-collector-builder_0.35.0_linux_amd64
mv ~/opentelemetry-collector-builder_0.35.0_linux_amd64 /usr/bin/opentelemetry-collector-builder
chmod 755 /usr/bin/opentelemetry-collector-builder
```
- Validate our dependencies
```
go version ## should be 1.17.0
which opentelemetry-collector-builder
```
2. Build the collector using Honeycomb’s recommended configuration
- Your .otelcol-builder.yaml will just use the Honeycomb recommended config, including Honeycomb's custom timestampprocessor (which will compact our events)
`[root@builder /] vi .otelcol-builder.yaml`
  dist:
    module: github.com/open-telemetry/opentelemetry-collector-builder
    include_core: true
    otelcol_version: "0.30.0"
  processors:
    - gomod: "github.com/open-telemetry/opentelemetry-collector-contrib/processor/metricstransformprocessor v0.30.0"
    - gomod: "github.com/honeycombio/opentelemetry-collector-configs/timestampprocessor v0.1.0"
3. Build the actual collector for export into your collector instance
```
[root@builder /] opentelemetry-collector-builder --config ./.otelcol-builder.yaml  --name honeycomb-otel-metrics-collector
```
4. Set up an opentelemetry collector instance
- Provision an EC2 instance based on AWS's Linux 2 AMI (ami-087c17d1fe01783150). t2.micros will run out of memory, so I recommend t2.small or higher
- Install dependencies (systemctl) and the otel-collector RPM from the OpenTelemetry repository
```
[ec2-user@collector /home/ec2-user]:
sudo -i
yum update && yum -y install wget systemctl
wget https://github.com/open-telemetry/opentelemetry-collector/releases/download/v0.32.0/otel-collector-0.32.0-1.x86_64.rpm
rpm -ivh otel-collector-0.32.0-1.x86_64.rpm
```
- Setup an initial collector config file. This is a basic sample that scrapes Prometheus data from one host and sends it via the otlp/metrics exporter and prometheus pipeline into Honeycomb.
We won't get into all the components in this post, but filtering and relabeling are other ways to minimize the number of events while enhancing the usability of your data.
```
vi /etc/otel-collector/config.yaml
```
extensions: health_check: pprof: endpoint: 0.0.0.0:1777 zpages: endpoint: 0.0.0.0:55679receivers: prometheus: config: scrapeconfigs: - jobname: ‘otel-collector’ scrapeinterval: 10s staticconfigs: - targets: [ ‘0.0.0.0:8888’ ]
prometheus: config: scrapeconfigs: - jobname: “production” scrapeinterval: 120s honorlabels: true static_configs: - targets: [’
:9256’] processors: batch:
exporters: logging: logLevel: debug otlp/metrics: endpoint: “api.honeycomb.io:443” headers: “x-honeycomb-team”: “<apikey>” “x-honeycomb-dataset”: “<datasetname>”
service: pipelines: metrics: receivers: [prometheus] processors: [] exporters: [otlp/metrics]
5. Transfer the opentelemetry collector to the collector instance
- You've got options - choose whatever makes sense for your workflow (S3 transfer, scp, etc)
6. Update the collector service startup script
- Update the startup script that comes with the RPM to use the custom OpenTelemetry Collector we built in the last section. ExecStart should point at your custom collector (e.g. "ExecStart=/usr/bin/honeycomb-otel-metrics-collector")
```
[ec2-user@collector /home/ec2-user]:
vi /usr/lib/systemd/system/otel-collector.service
```
7. Start the instance on the collector
-
```
[ec2-user@collector /home/ec2-user]:
sudo systemctl stop otel-collector
sudo systemctl status otel-collector
```
8. Check health and validate metrics in your dataset
- And now....check on your assigned dataset in Honeycomb.io - hopefully you're seeing data coming in! 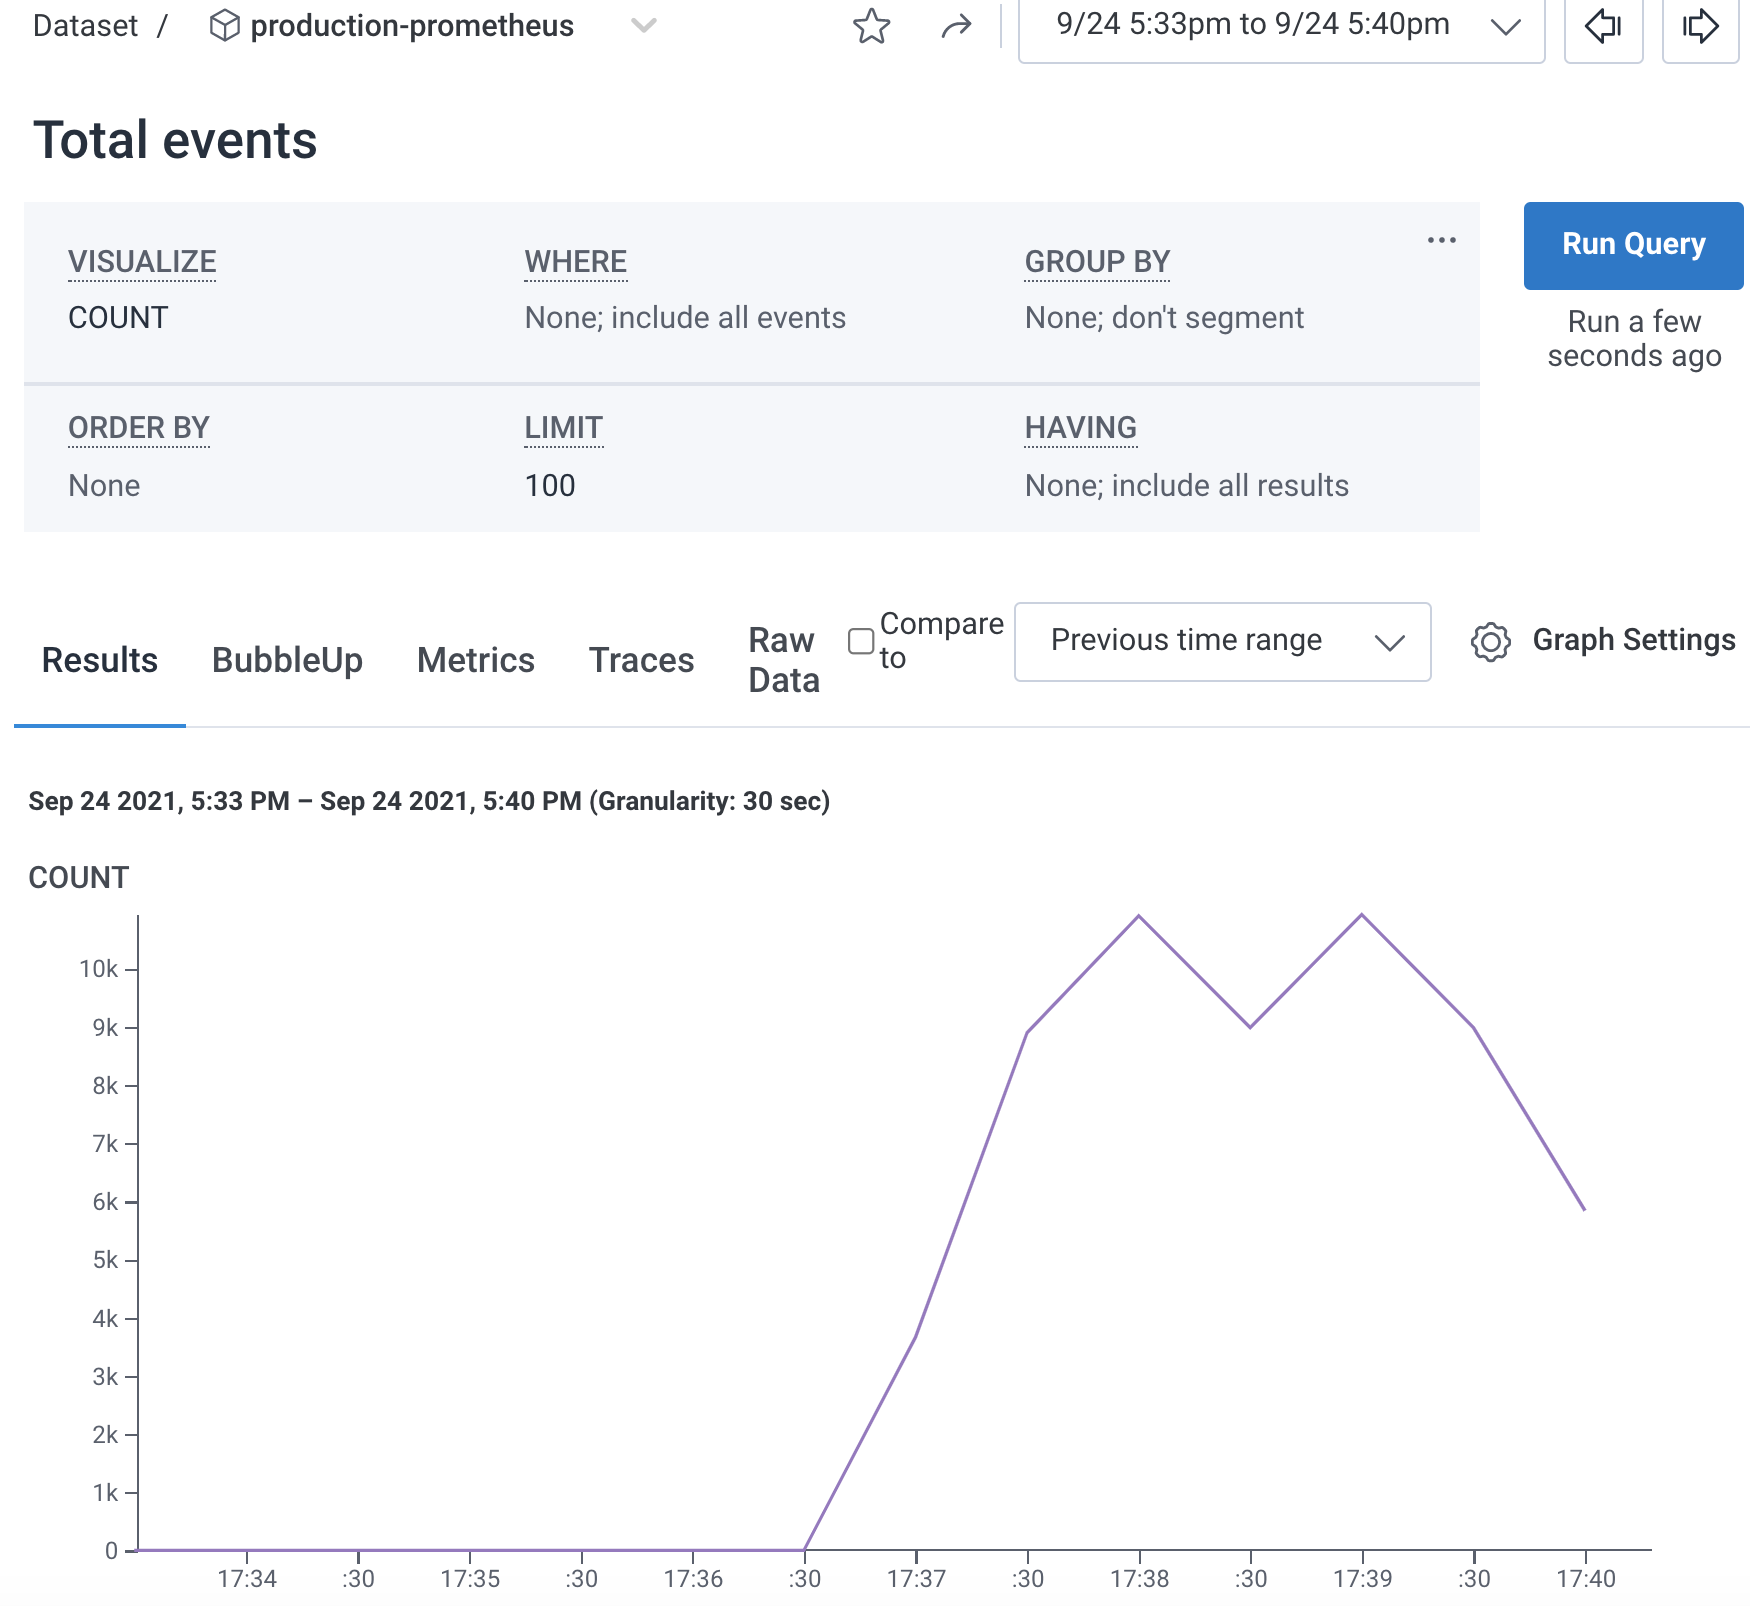
- It will be spiky! Check out these tips for smoothing out your query view.
You’ve now successfully implemented the new Honeycomb Metrics collector and are sending data efficiently into your observability hub! I wish you the best as you and your team start to dig into your new findings.